GA4's standard reports live under Reports in the left menu, grouped into two collections: Life cycle (Acquisition, Engagement, Monetization, and Retention) and User (Demographics and Tech). Most marketers spend their time in the Acquisition reports (where traffic comes from) and the Engagement reports (what people do once they arrive).
GA4’s reporting menu throws a lot of people. There are fewer reports than the old Universal Analytics had, they’re named differently, and it’s not always obvious where to look for a simple answer like “where did my traffic come from?”
This is a tour of every standard report, what each one shows, and when it’s the right place to look. By the end you’ll know exactly where to go for the questions you ask most.
Before you start: These reports only show data once GA4 is collecting it. If you’re not set up yet, follow the installation guide first.
How GA4 reports are organized
Click Reports in the left menu. You’ll find three layers.
At the top is the Reports snapshot, an overview page of summary cards. Below it, reports are sorted into two groups called collections.
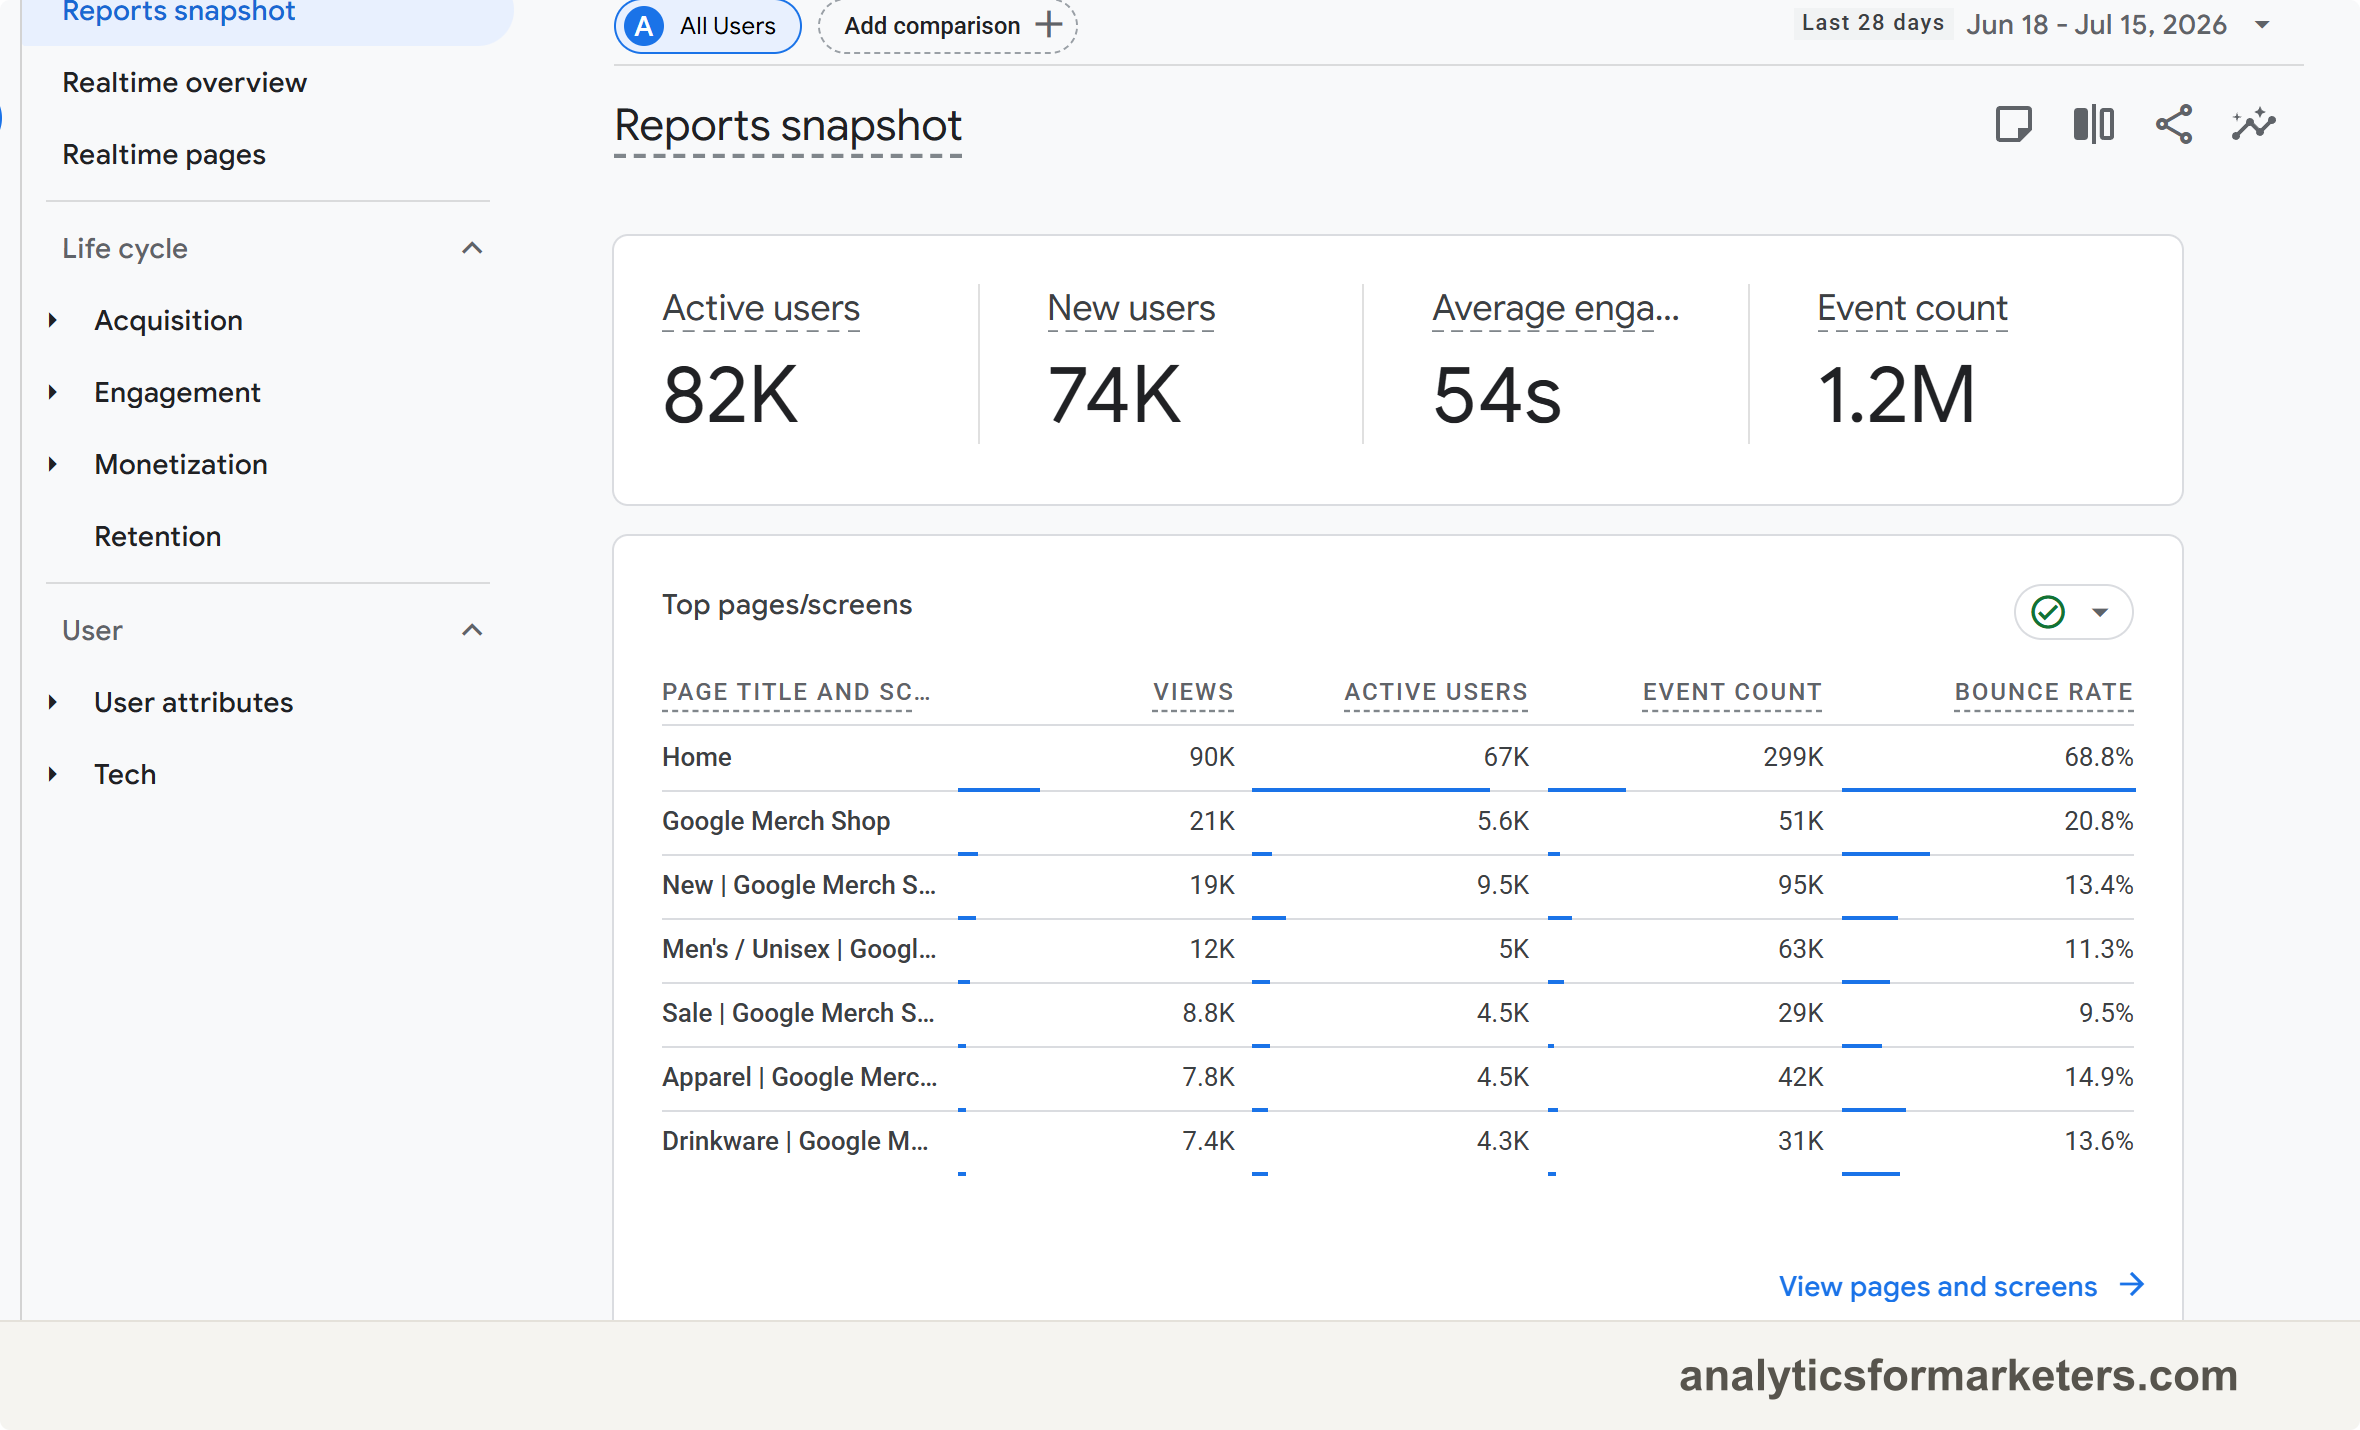
| Collection | Reports inside | Answers |
|---|---|---|
| Life cycle | Acquisition, Engagement, Monetization, Retention | How people find you and what they do |
| User | Demographics, Tech | Who your visitors are and how they browse |
Google’s overview of this structure is in About Google Analytics 4 reports. Now let’s go through the ones that matter.
The Acquisition reports
This is where most marketers start. Acquisition answers “where does my traffic come from?” There are two reports here, and the difference trips people up.
User acquisition shows how brand-new users first found you. It’s first-touch: the very first way someone discovered your site.
Traffic acquisition shows where all your sessions come from, new visitors and returning ones alike.
Here’s what that means in practice: if someone finds you through Google, leaves, then comes back later by typing your URL, User acquisition credits Google (the first touch), while Traffic acquisition shows both visits by their real source.
For day-to-day channel reporting, Traffic acquisition is usually the one you want. Look at the Session default channel group to see Organic Search, Direct, Paid Search, Social, and so on.
The Engagement reports
Engagement answers “what do people do once they’re here?” This group has the reports you’ll use second-most. (If you’re wondering where bounce rate went, it became engagement rate, and the two are mirror images.)
- Events: every event your site fires and how often. This is where custom events show up.
- Key events: the actions you’ve flagged as important (what GA4 used to call conversions). New here? See the key events guide.
- Pages and screens: your most-viewed pages, with views, users, and average engagement time.
- Landing page: the first page people see when they arrive, which pairs well with Traffic acquisition for judging campaigns.
If you write content, Pages and screens and Landing page will become your home base.
The Monetization reports
If you run a store, this group tracks revenue: purchases, items, promotions, and checkout steps. It only fills with data once you’ve set up e-commerce tracking, which sends events like purchase and add_to_cart with the right details.
If you’re a lead-gen or content site, you can skip this group. Your “value” lives in the Engagement reports as key events instead.
The Retention report
Retention answers “do people come back?” It shows new vs returning users, how long they keep visiting, and (for stores) lifetime value. It’s most useful for apps, subscriptions, and content sites that live or die on repeat visitors.
The User reports
The User collection has two reports:
- Demographics: country, city, language, and (when available) age, gender, and interests.
- Tech: browser, device category, operating system, and screen size.
Tech is genuinely useful. If your bounce is high on one browser or your mobile numbers look off, this is where you’ll spot it.
The Realtime report
Realtime (near the top of the Reports menu) shows activity from roughly the last 30 minutes. It won’t help with trends, but it’s perfect for one thing: confirming that a change you made is working. Publish a page, trigger an event, and watch it appear here within seconds.
Which reports marketers actually use
You don’t need all of them. Here’s the short list that answers most questions:
| Question | Report |
|---|---|
| Where’s my traffic from? | Acquisition > Traffic acquisition |
| Which pages perform? | Engagement > Pages and screens |
| Are people converting? | Engagement > Key events |
| Did my campaign land? | Engagement > Landing page + Traffic acquisition |
| Is it working right now? | Realtime |
Start there. You can always dig deeper later.
What to do next
Now that you can read the standard reports, here’s where to go from here:
- Shape the view around your work by learning how to build a GA4 dashboard.
- Report on data GA4 doesn’t track by default (like blog author or plan type) with custom dimensions.
- Send your key events to Google Ads if you run paid campaigns.
For the full picture of how GA4 works, start with our GA4 beginner’s guide.